V/01
E.
DIRECTION 01 · LIVE DEMO
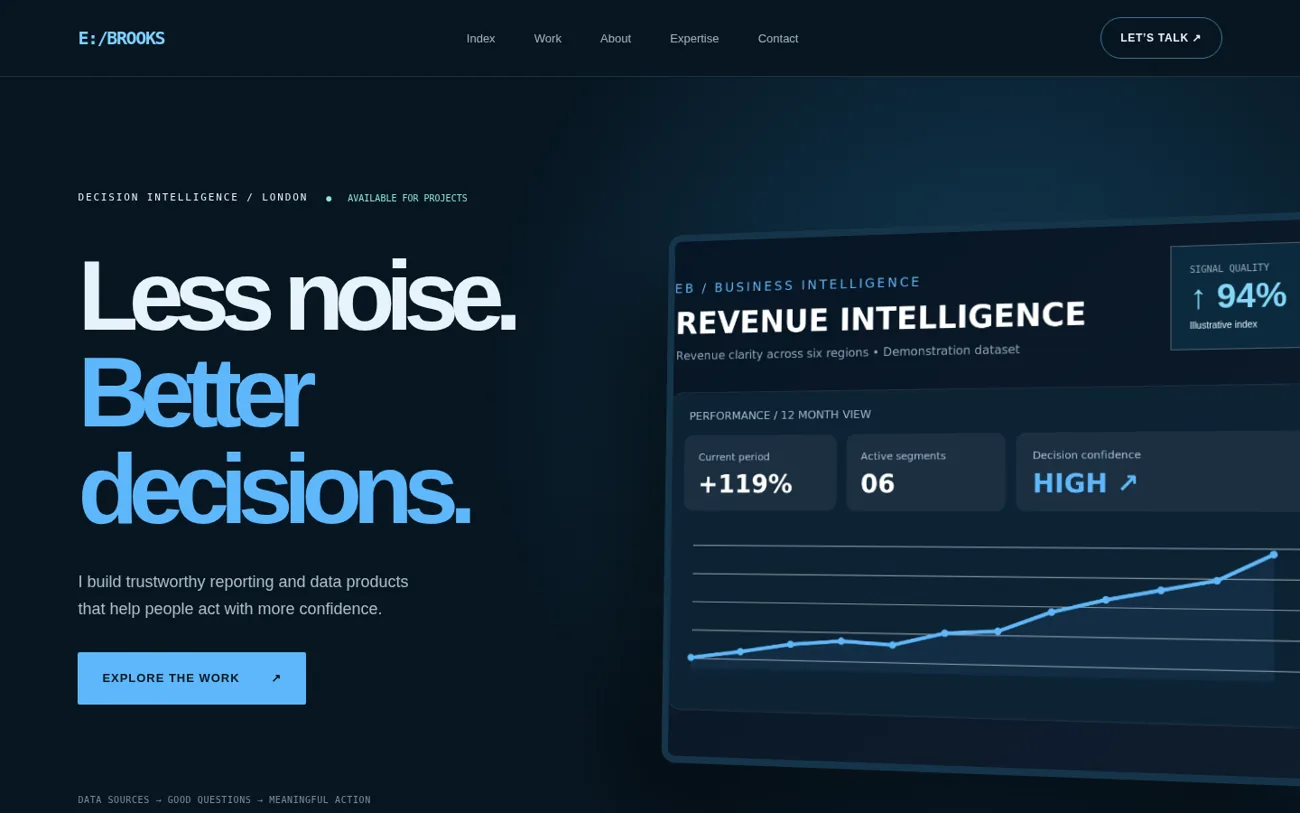
Graphite Metrics
The original dark dashboard-first visual direction.
Ask about this directionGRAPHITE / PRECISION / NO. 07
Dashboards and data stories need context. Present decisions, methods and outcomes with an analytical aesthetic that still feels human.
THE DESIGN POINT OF VIEW
Dashboards and data stories need context. Present decisions, methods and outcomes with an analytical aesthetic that still feels human.
This demo uses a fictional professional and sample projects. Your finished website replaces those with verified work, your real experience and your preferred contact details.
EXPLORE THE REAL BUILD
Not a concept render. You can open the working multi-page demonstration and explore its navigation, projects and mobile layout.
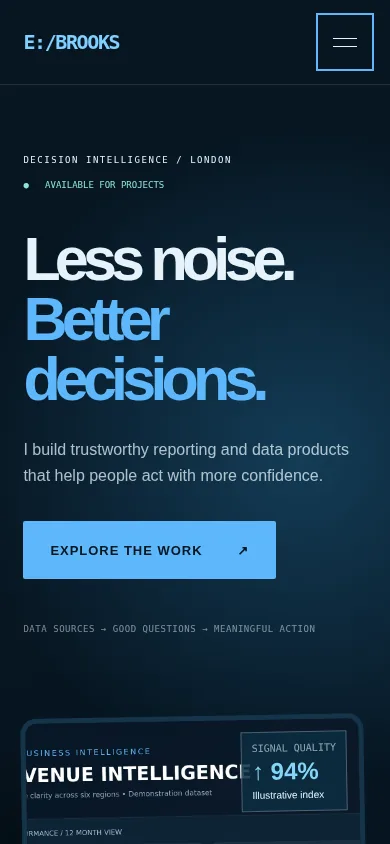
We refine hierarchy, navigation, spacing and image crops for smaller screens instead of squeezing a desktop layout down.
Explore the full website ↗POSSIBLE ART DIRECTIONS
Choose the original design or talk to us about an alternative visual direction. Variations beyond the original demo require a customization quote.
The original dark dashboard-first visual direction.
Ask about this directionLight, clean executive analytics storytelling.
Ask about this directionEditorial methods, charts and written insights.
Ask about this directionCONTENT THAT MAKES SENSE
HOW PRICING WORKS
Starter includes a tailored, up-to-three-page adaptation of your selected visual direction. To recreate the full nine-page demo, or build expressive advanced motion, explore Professional and Premium scopes.
For a custom-styled multi-page portfolio (up to 3 pages).
Get a personalized quoteUnderstand packagesTHIS COULD BE YOUR SITE
No code to learn. No confusing dashboard. Just a website that feels like you.