Revenue Intelligence
A shared commercial view from six fragmented reporting sources.
ROLE Metric design, SQL modeling, dashboard architectureYEAR 2026TYPE SPECULATIVE PROJECT
01 / THE CONTEXT
A better question makes a better brief.
A fictional multi-region services company could not reconcile pipeline, recognized revenue and delivery performance.
02 / THE RESPONSE
Make the thinking visible.
Created a common revenue vocabulary and modeled the steps between booked work, invoiced value and recognized revenue.
From premise to execution.
01
Interview imaginary revenue and finance stakeholders to define key decisions.
02
Build a synthetic star-schema model with documented grain and joins.
03
Design drill-downs that preserve meaning as users move from group to region.
06REGION VIEWS
12MONTHS MODELED
100%DEMO DATA
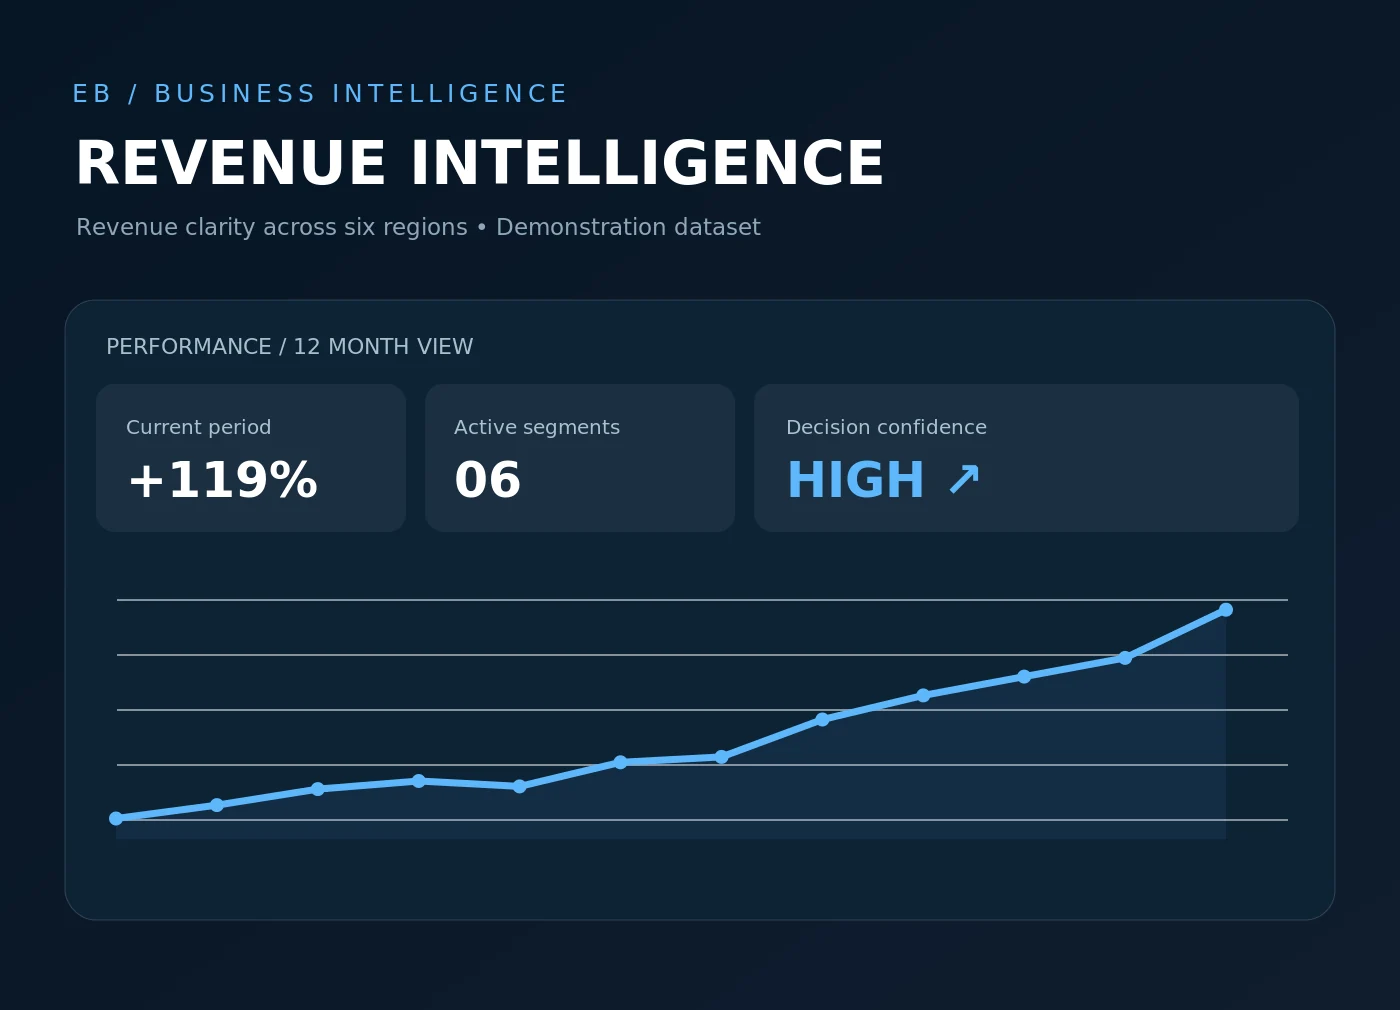
Fully illustrative dashboard. Synthetic metric scenario shows +119% index growth; no actual company performance is asserted.
FICTIONAL PORTFOLIO / DEMONSTRATION PROJECTSVisual study.
Original illustrative assets. Click an image to inspect it.